Overview
AugerOS is a unified operations platform designed to transform a fragmented, reactive supply‑chain workflow into a cohesive, AI‑guided experience.
My Role
Product Design LeadThe team
Chief Product Officer, UX Director, Product Design LeadTIMELINE
June 2025About
AugerOS is a unified operations platform designed to transform a fragmented, reactive supply‑chain workflow into a cohesive, AI‑guided experience. The system integrates real‑time visibility, execution tools, and predictive intelligence through a design approach centered on clarity, actionability, and cross‑functional alignment.At the core of the platform is RANG/R, an adaptive AI layer that augments operator decision‑making with inline recommendations, predictive analytics, and guided collaboration.
Task / solution
- Adaptive and Context-Aware Design
The UI dynamically adjusts based on user context. This includes content density, and interface complexity tailored to user needs and situational demands. - RANG/R AI Orchestration
RANG/R enables real-time orchestration of AI agents, integrating retrieval-augmented generation (RAG), and contextual reasoning to deliver personalized, context-aware recommendations and actions. - Modular Architecture
The system is composed of discrete modules—context acquisition, modeling, adaptation, AI orchestration, data management, privacy, and performance monitoring—facilitating extensibility, scalability, and maintainability. - Personalization and Learning
User profiles, behavioral analytics, and feedback loops inform continuous refinement of recommendations, routing, and interface adaptations. - Privacy-First Design
Data minimization, on-device processing, transparent consent management, and compliance with global and state-level privacy regulations are foundational. - Performance and QoS
Edge caching, vector tile rendering, load balancing, and real-time monitoring ensure low latency, high availability, and robust scalability.
The Problem
Teams across packaging, rail, and ocean logistics were navigating:- Disconnected tools and siloed data
- Manual, error‑prone decision flows
- Limited visibility into upstream/downstream impacts
- High cognitive load and constant context switching
- No shared mental model of the end‑to‑end network
The GOAL
Deliver an integrated suite that provides end‑to‑end visibility across open orders, inventory, and process flows—while enabling optimized, AI‑guided decision support across scheduling, packaging, rail car routing, and backlog management.DESIGN CHALLENGES
- Variations in user age, vision, digital literacy, and spatial abilities necessitate adaptive interfaces.
- Environmental factors, temporal changes, and evolving user tasks require real-time adaptation.
- Handling multiple layers, real-time analytics, and large datasets without overwhelming users or degrading performance.
- Ensuring clarity, accessibility, and intuitive navigation across devices and contexts.
- Managing sensitive geolocation data in compliance with evolving regulations.
- Integrating AI, data sources, and external tools while maintaining scalability and quality of service.
Research & Insights
Understanding the context
and the user mindset
The design process started on the ground. The team went to the field to observe current shift handovers. We watched how operators from an outgoing shift briefed the incoming shift, noting what information was exchanged and how. We collected examples of the paper forms and logs used.
Ethnographic research was key: understanding the context and user mindset. This phase uncovered the critical pieces of info needed in a handover and the pain points. The team also interviewed operations supervisors to get their requirements.
Market research was also done on existing AutoML in supply chain magangment tools. Insights showed that average users found ML model selection and tuning daunting, and needed more guidance.
Our team began by studying target users who struggle with ML’s complexity. They analyzed how these users currently attempted predictive modeling to identify pain points.
![]()
Ethnographic research was key: understanding the context and user mindset. This phase uncovered the critical pieces of info needed in a handover and the pain points. The team also interviewed operations supervisors to get their requirements.
Market research was also done on existing AutoML in supply chain magangment tools. Insights showed that average users found ML model selection and tuning daunting, and needed more guidance.
Our team began by studying target users who struggle with ML’s complexity. They analyzed how these users currently attempted predictive modeling to identify pain points.
Competitive evaluation
Methods
- Contextual inquiry at packaging and rail facilities
- Stakeholder interviews across planning, packaging, rail, and vendor management
- Data audits of backlog patterns, exceptions, and cycle times
Personas
- Planner: capacity, sailings, prioritization
- Packaging Lead : SCPOs, throughput, rail alignment
- Command Center Operator: KPIs, alerts, orchestration
- Vendor Manager: performance, benchmarking, negotiations
Key Insights
- Operators need both situational awareness and immediate execution controls
- Trust in AI requires explainability, not automation alone
- Cross‑team coordination is the biggest source of delay
- Visual clarity dramatically reduces decision latency
This led to defining key user needs:
“I want to input my data and get a reliable model without tweaking dozens of settings”.
Experience Architecture
A modular system connected by global filters, shared patterns, and a persistent navigation bar.
Deliver an integrated suite that not only provides end-to-end visibility across open orders, inventory, and process flows—but also offers optimized, AI-guided decision support (via RANG/R) across critical functions such as scheduling, packaging, and rail car routing.
![]() Whiteboarding workshop to define overall architacture and vision
Whiteboarding workshop to define overall architacture and vision
 Whiteboarding workshop to define overall architacture and vision
Key Pillars
- Transparency
Real-time data on order status, inventory, and shipment progress. - Actionability
Execution apps with interactive controls for schedule modifications, cancellation, or reassignment. - Proactive Orchestration
AI-driven recommendations that anticipate bottlenecks and propose actionable “what-if” scenarios. - Collaboration
Integrated communication features that enable immediate coordination across teams.
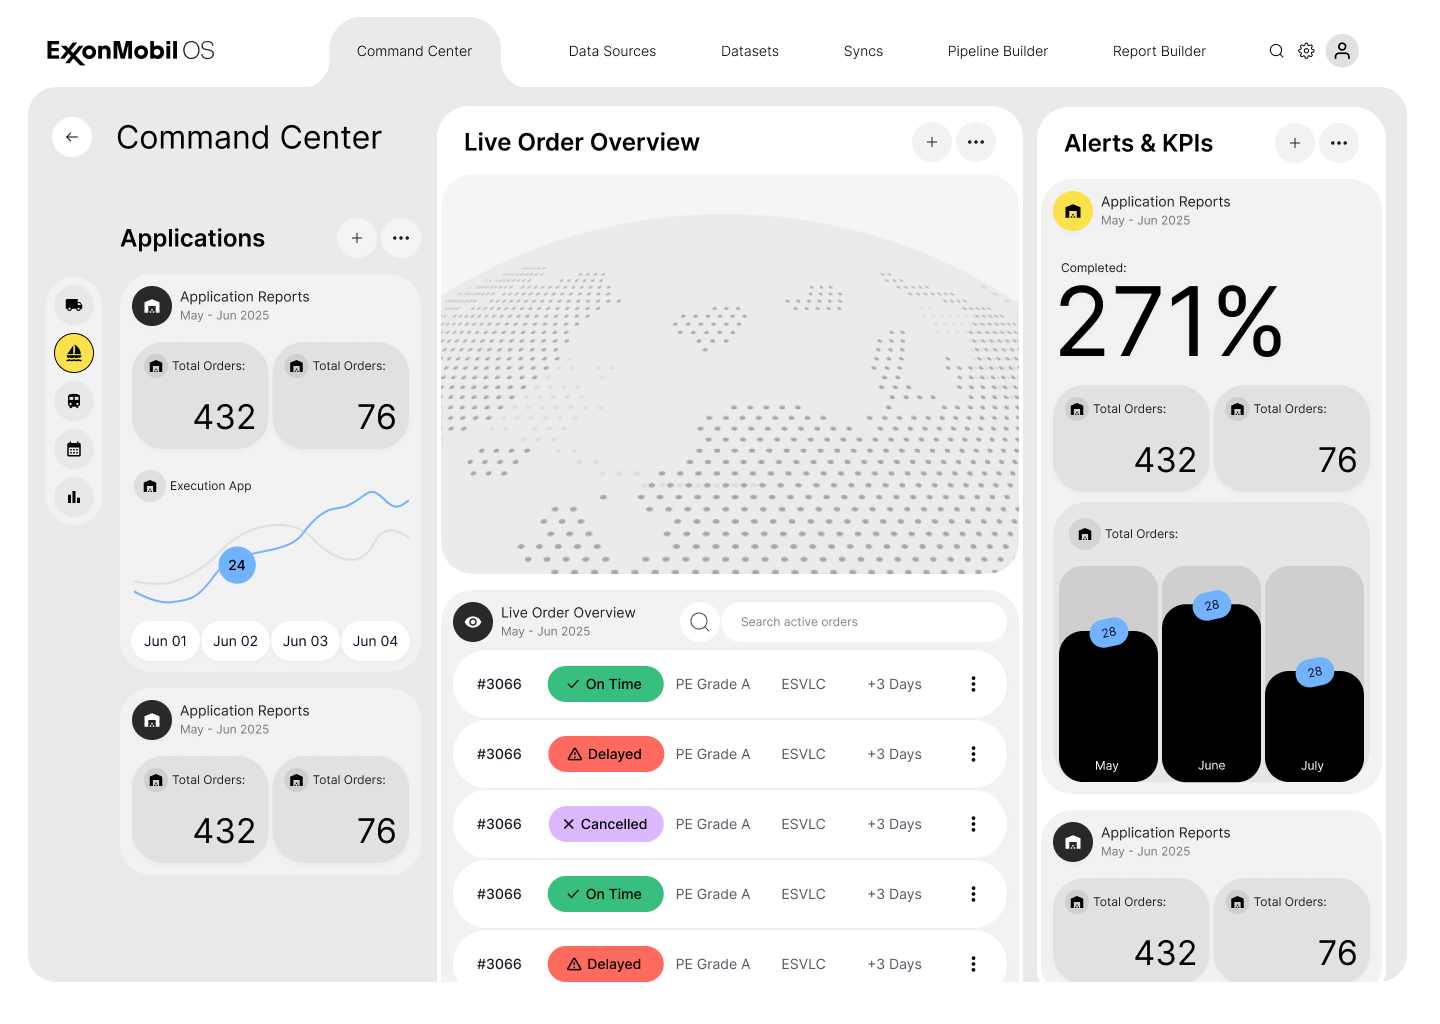
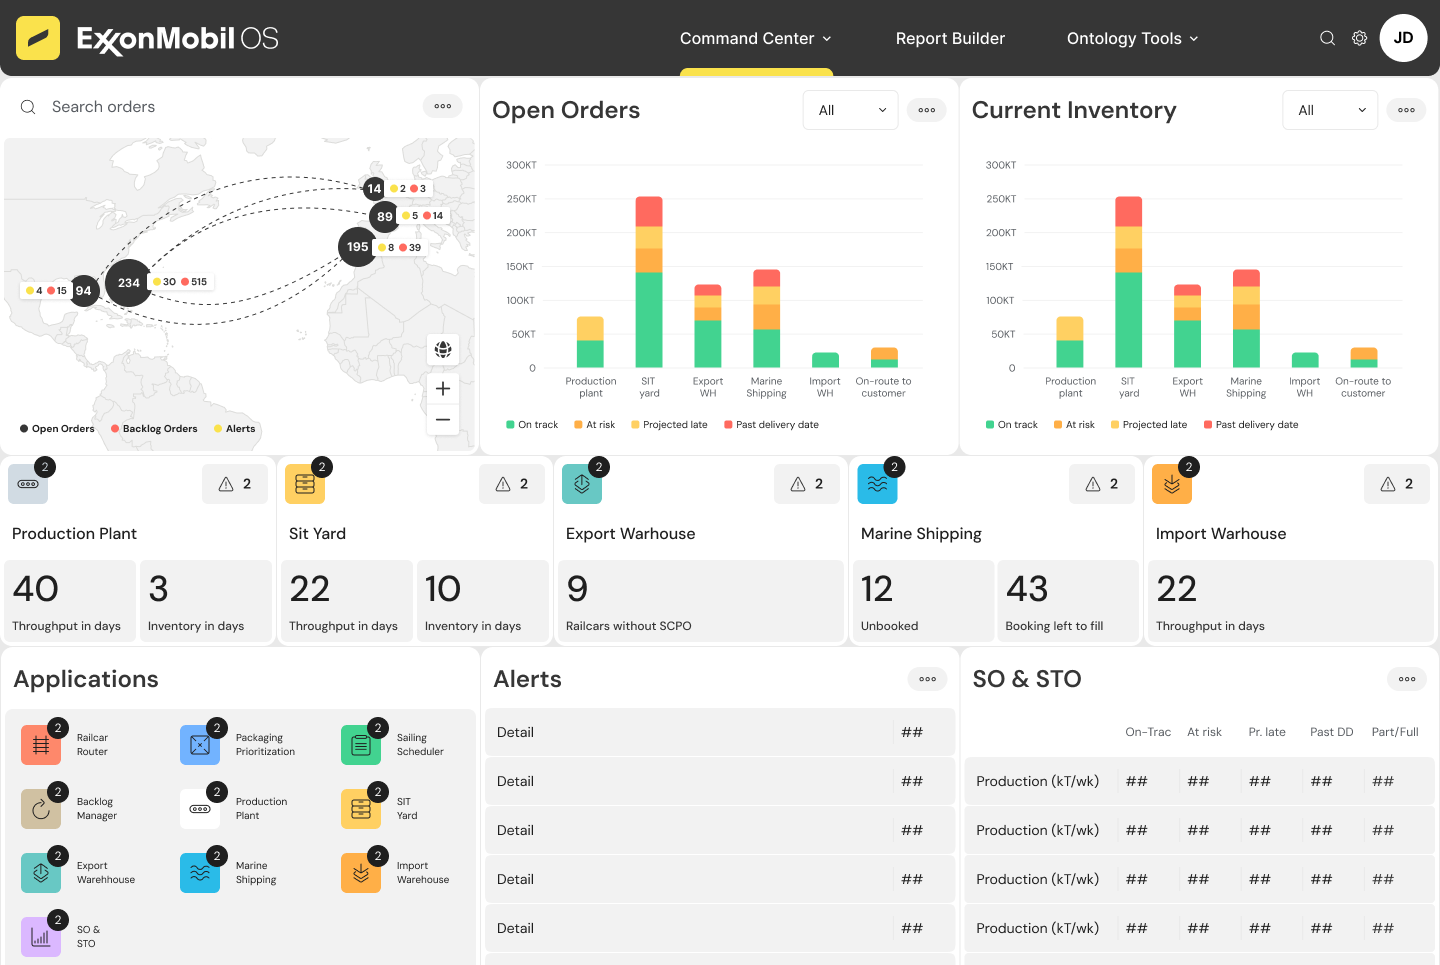
The Command Center & process visability
Offer a high-level view to monitor overall end-to-end operations while allowing operators to drill down into specific modules (Sailing Scheduler, Packaging Prioritization, Railcar Router, etc.) for active decision-making.

Command Center Wireframe
Key Functions & UI Elements:
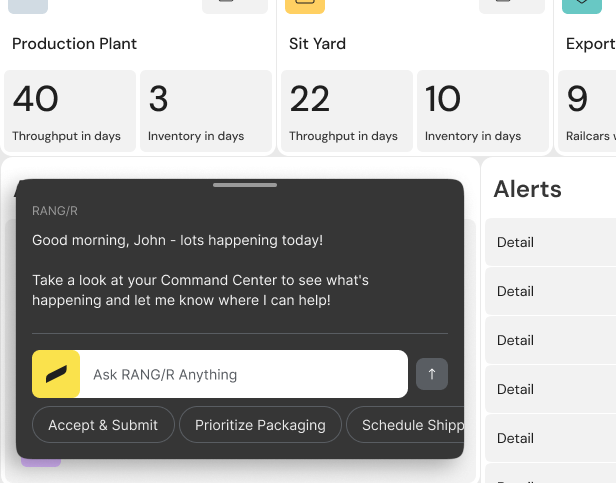
- Real-Time Metrics Widgets: Displays KPIs such as open orders, inventory velocity, container capacity utilization, and backlog volumes.
- Includes trend indicators (improvements or deteriorations) with color-coded statuses.
- Live Alert Stream: A side panel that continuously lists real-time alerts (e.g., delayed rail car moves, missed container bookings) with actionable buttons for immediate response.
Integrated Collaboration & AI Assistance:
- Inline RANG/R Prompts: Recommendations appear next to critical metrics or alerts (e.g., “Escalate this order to the shipping desk”).
- Embedded Communication Tools: Buttons to initiate quick chats, notifications, or collaborative sessions directly from any alert or KPI widget.
Defining core modules
& their components
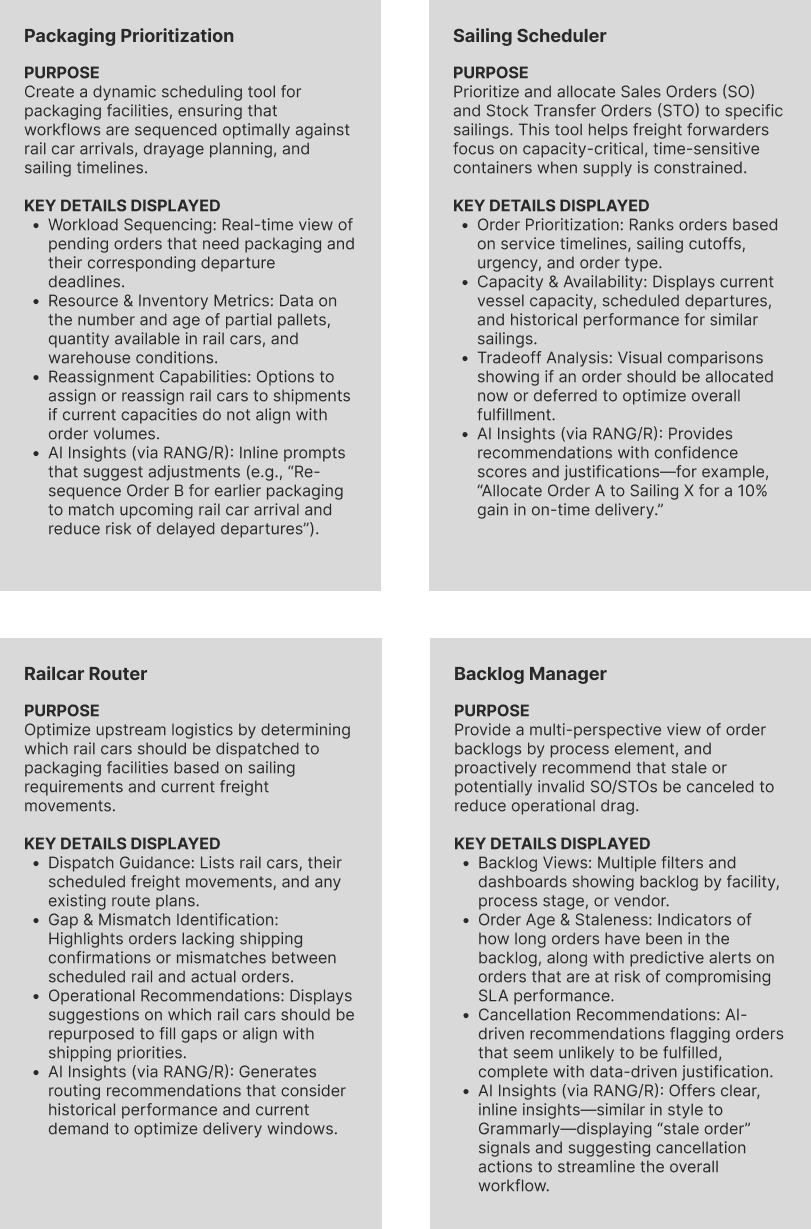
Sailing Scheduler
Designing for temporal reasoning
Packaging Prioritization
Designing for multi‑dependency alignment
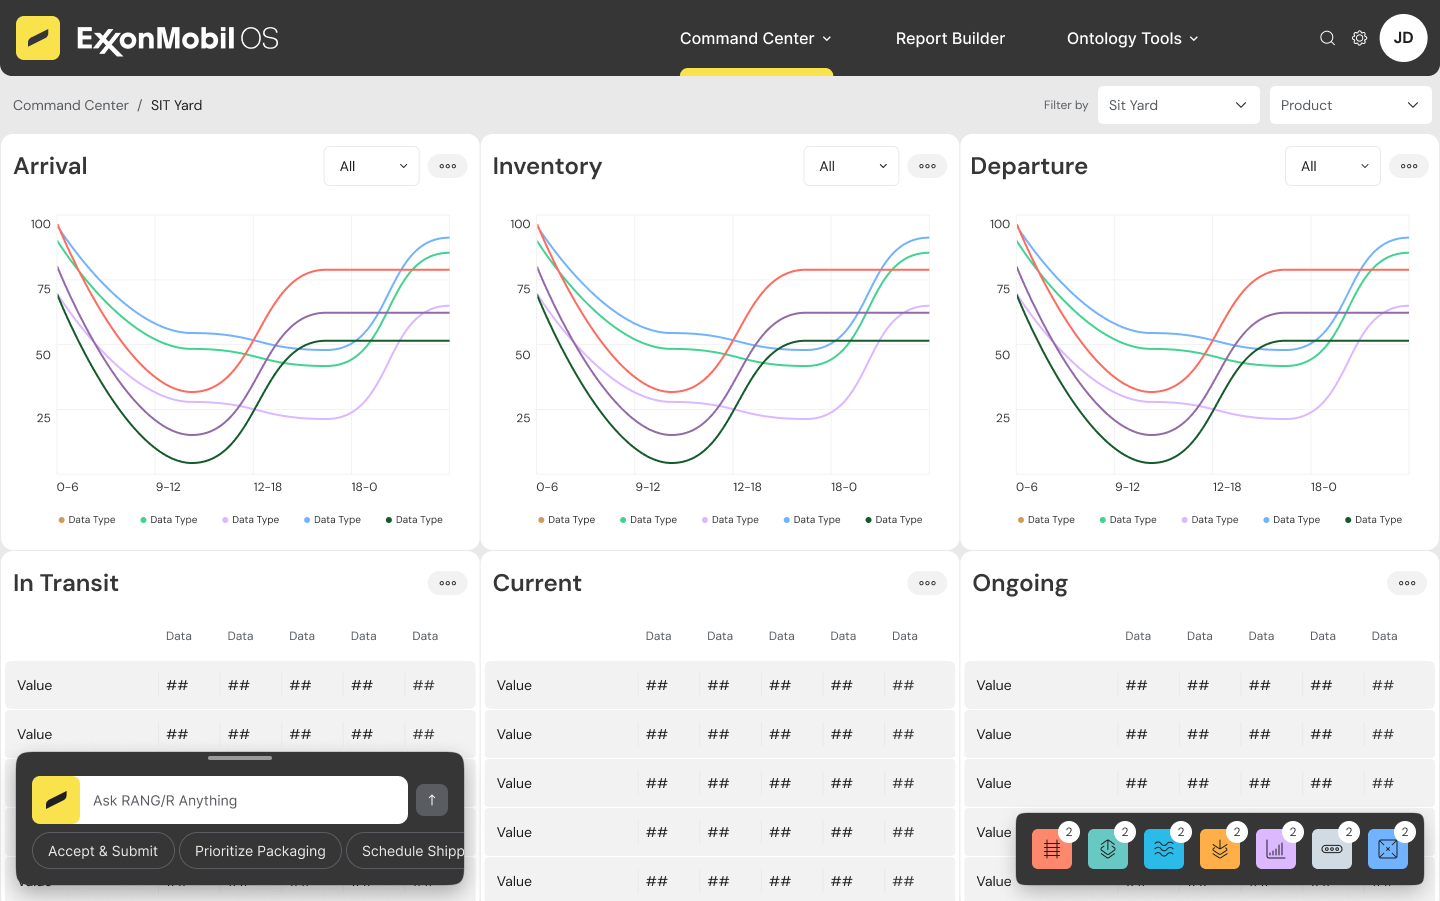
Open Orders & Inventory Pipeline
Designing a lifecycle mental model
Designing for temporal reasoning
-
Timeline/table hybrid for capacity and booking clarity
-
Drill‑downs for order‑level detail
-
Inline RANG/R suggestions with confidence scores
- Change logs to support version comparison
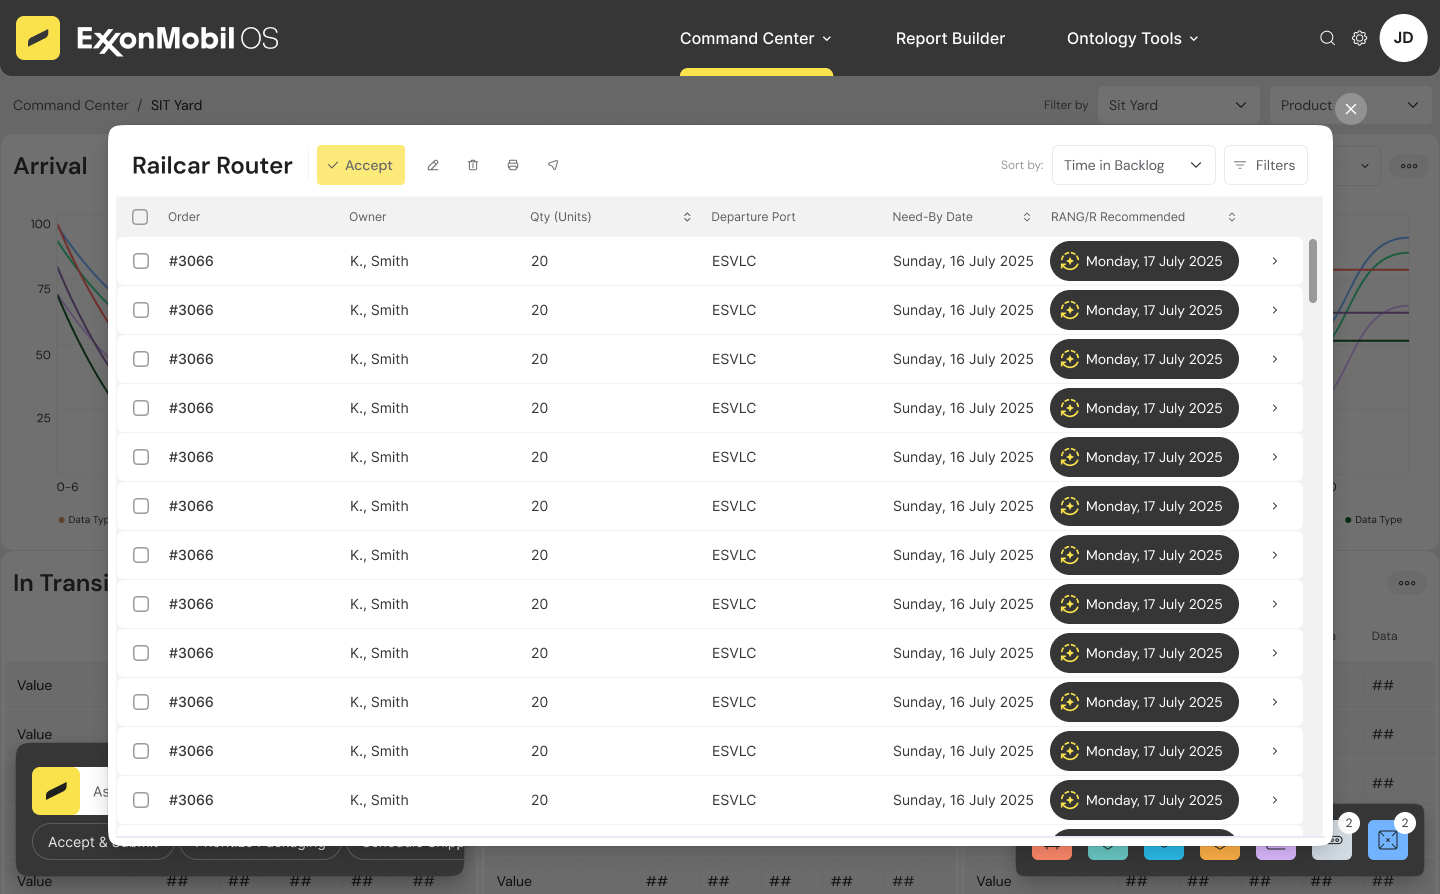
Packaging Prioritization
Designing for multi‑dependency alignment
- Dual‑panel layout: rail cars vs. packaging throughput
- STO/SCPO lists with missing‑product alerts
- AI prompts for resequencing and timing adjustments
Open Orders & Inventory Pipeline
Designing a lifecycle mental model
- Flow diagram with color‑coded risk states
- Dynamic inventory linkage
- Drill‑down analytics with AI insights
High Level Layout & Navigation

Unified Navigation Framework:
Modular & Responsive Design:
Consistency & Real-Time Updates:
- Global Navigation Bar: Remains visible across all pages (XBO and Command Center) with quick access to modules like Active Orders, Sailing Scheduler, Packaging Prioritization, Railcar Router, and Backlog Manager.
- Global filters (date, region, vendor, order status) are applied across modules for consistent data views.
Modular & Responsive Design:
- Dynamic Panels & Side Overlays: When an order or rail car is selected, a side panel slides in to provide detailed information, historical context, and actionable options.
- Tile-Based Command Center: The Command Center uses a tile-layout with large visual KPI widgets, process flow diagrams, simulation panels, and an alert feed—all designed for rapid situational awareness.
Consistency & Real-Time Updates:
- Change Tracking & Version Comparison: Each module maintains a log of modifications (new bookings, cancellations, reassignments) so users always know what’s changed since the previous schedule.
- Live Data Integration: All dashboards are updated in real time, ensuring that decisions are based on the latest operational data across ocean, rail, and packaging activities.
Use Case Flow:
User needs to navigate to backlog management from the command center and investigates why a specific order is delayed, reviews nodal score cards, requests
replenishment recommendations, and selects and executes a plan to resolve a backlog item.
User needs to navigate to backlog management from the command center and investigates why a specific order is delayed, reviews nodal score cards, requests
replenishment recommendations, and selects and executes a plan to resolve a backlog item.

UI Exploration
A no-nonsense, utilitarian aesthetic that prioritizes function over decoration, making data the focal point.
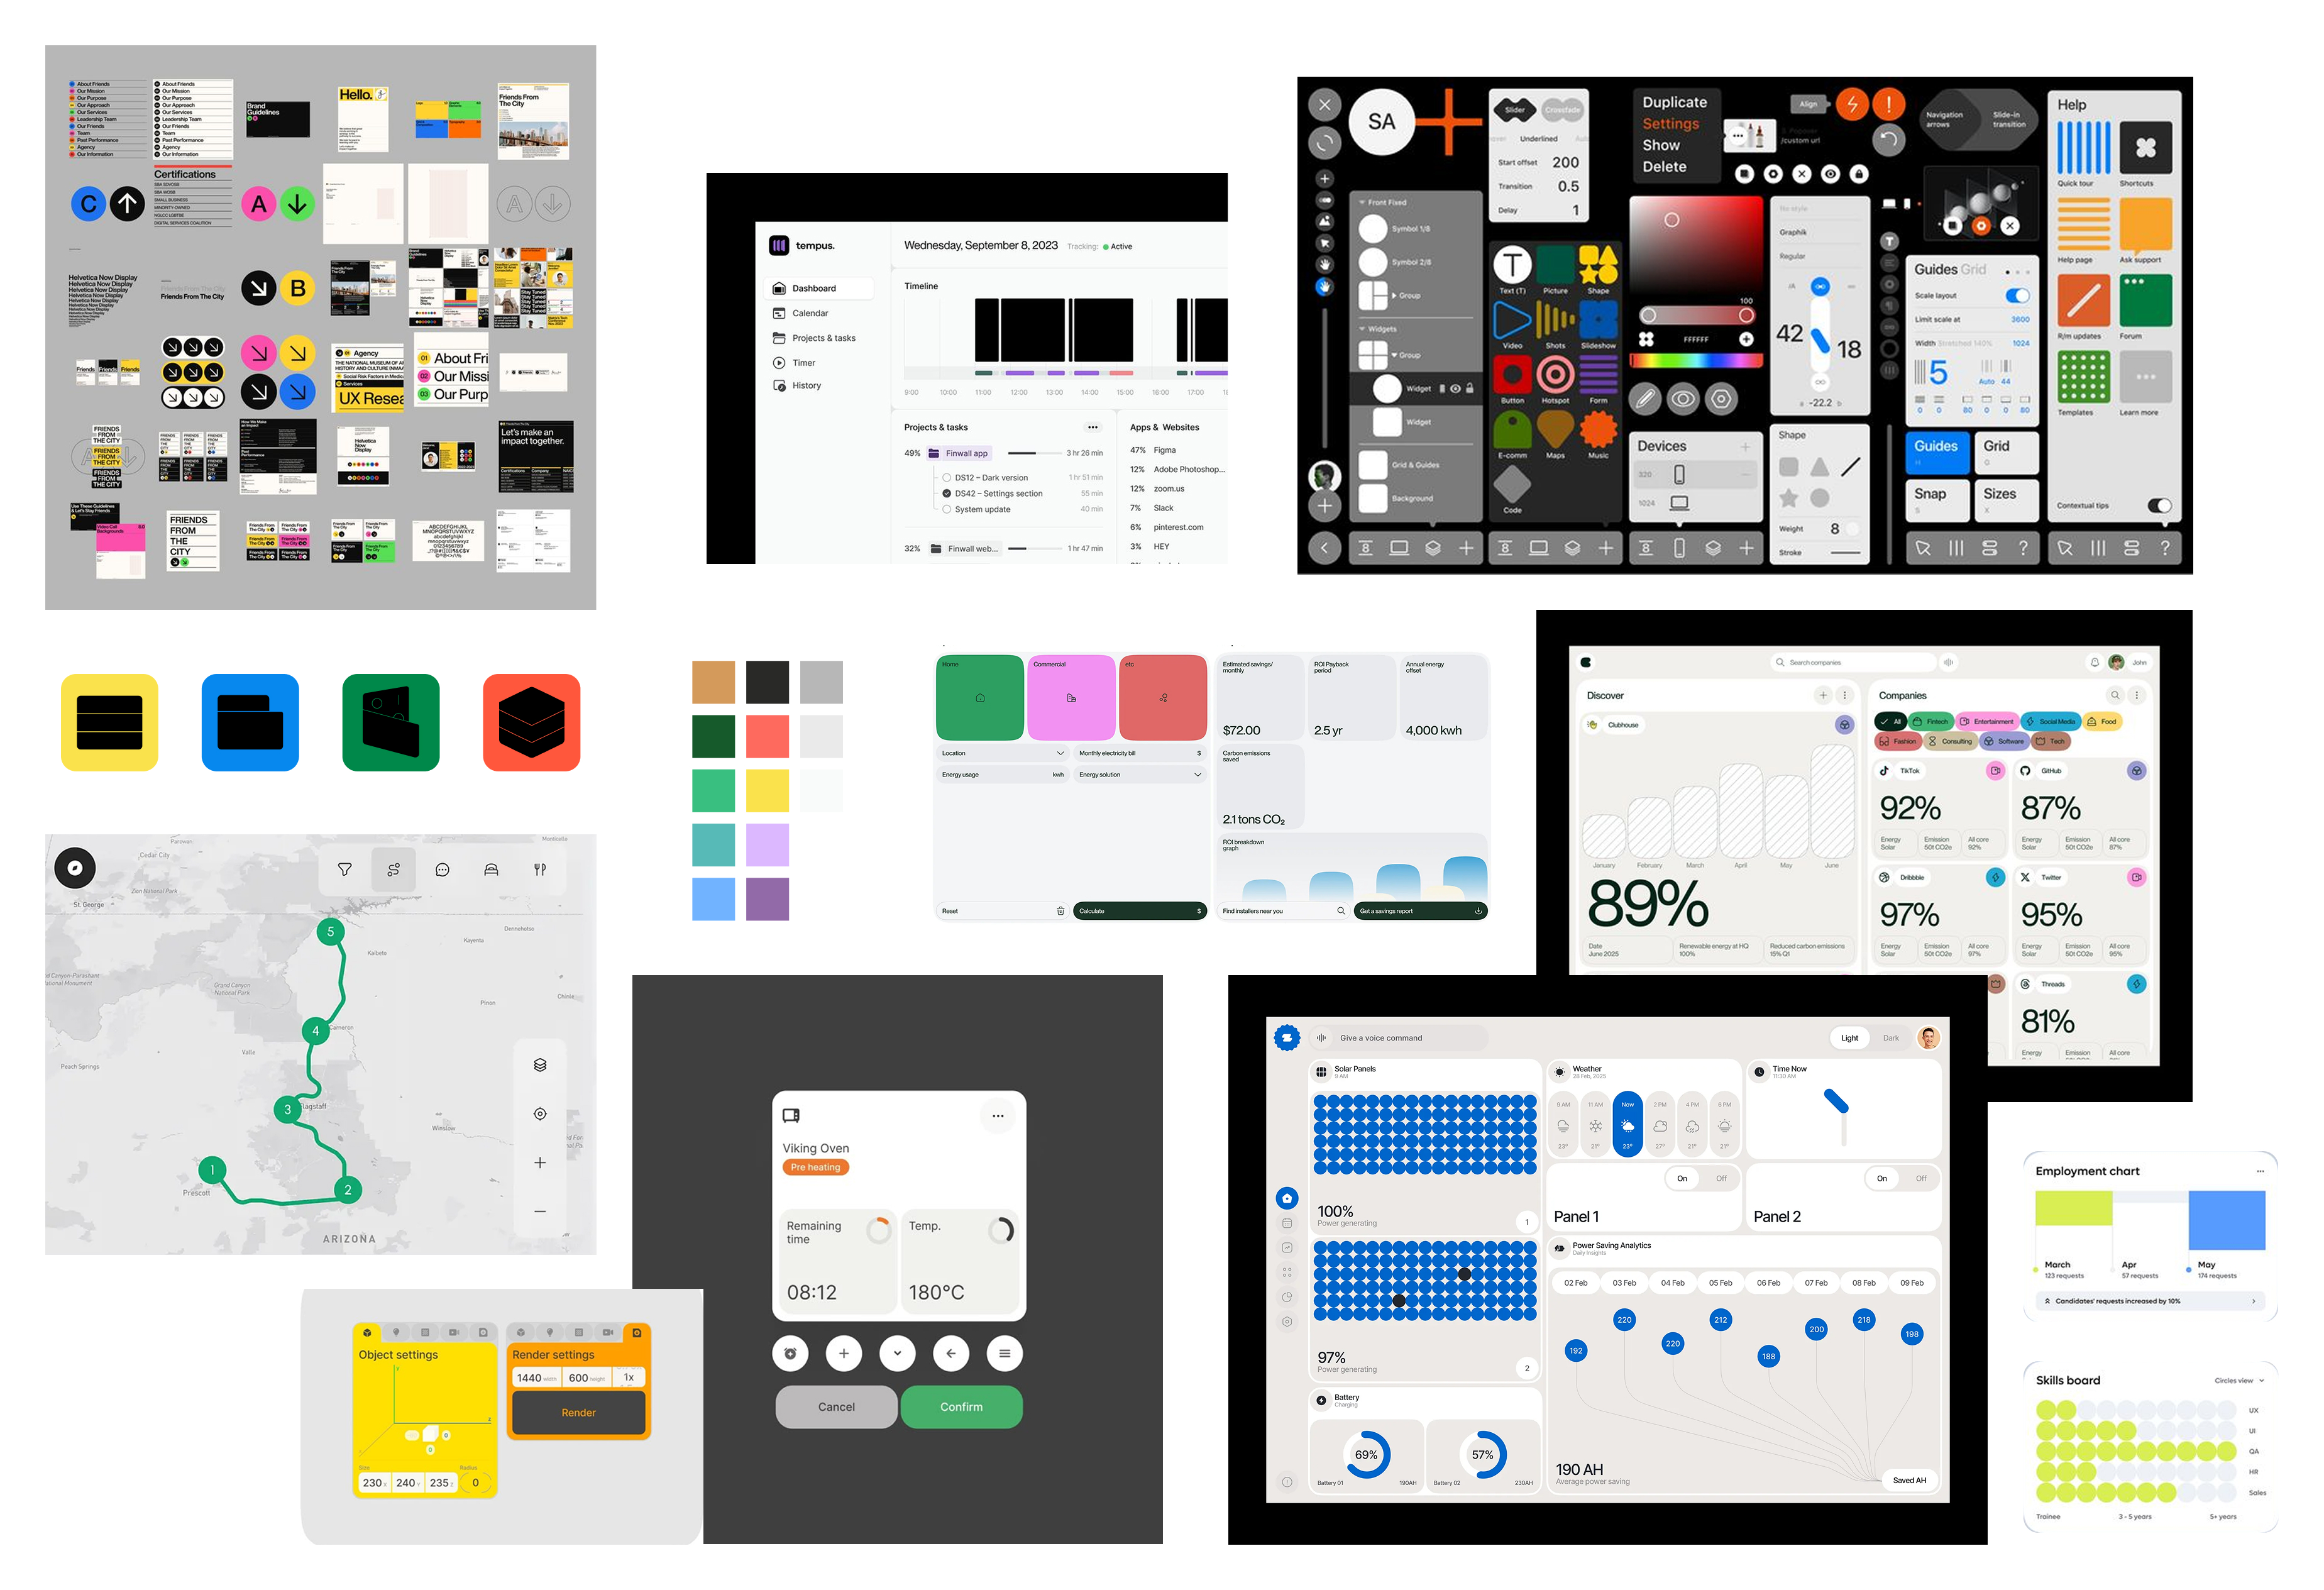
Selected moodboard direction
Industrial Brutalism
This direction communicates trust and transparency—no distractions, just raw data.
This is perfect for high-stakes logistics environments where clarity is paramount.
Key Elements:
- Monochrome or High-Contrast Colors: Stark backgrounds with bold accent colors for alerts.
- Heavy Typography: Large, blocky text with minimal ornamentation.
- Geometric & Asymmetric Layouts: Unpolished, raw UI elements that emphasize directness.
- Minimal Motion: No excessive animations—just snappy transitions for immediate responsiveness.

RANG/R
AI as a first‑class design element
RANG/R is woven throughout the platform as a first‑class design element, not a separate feature.

Predictive Analytics
- Early‑warning indicators
- Risk scoring badges
- Trend arrows

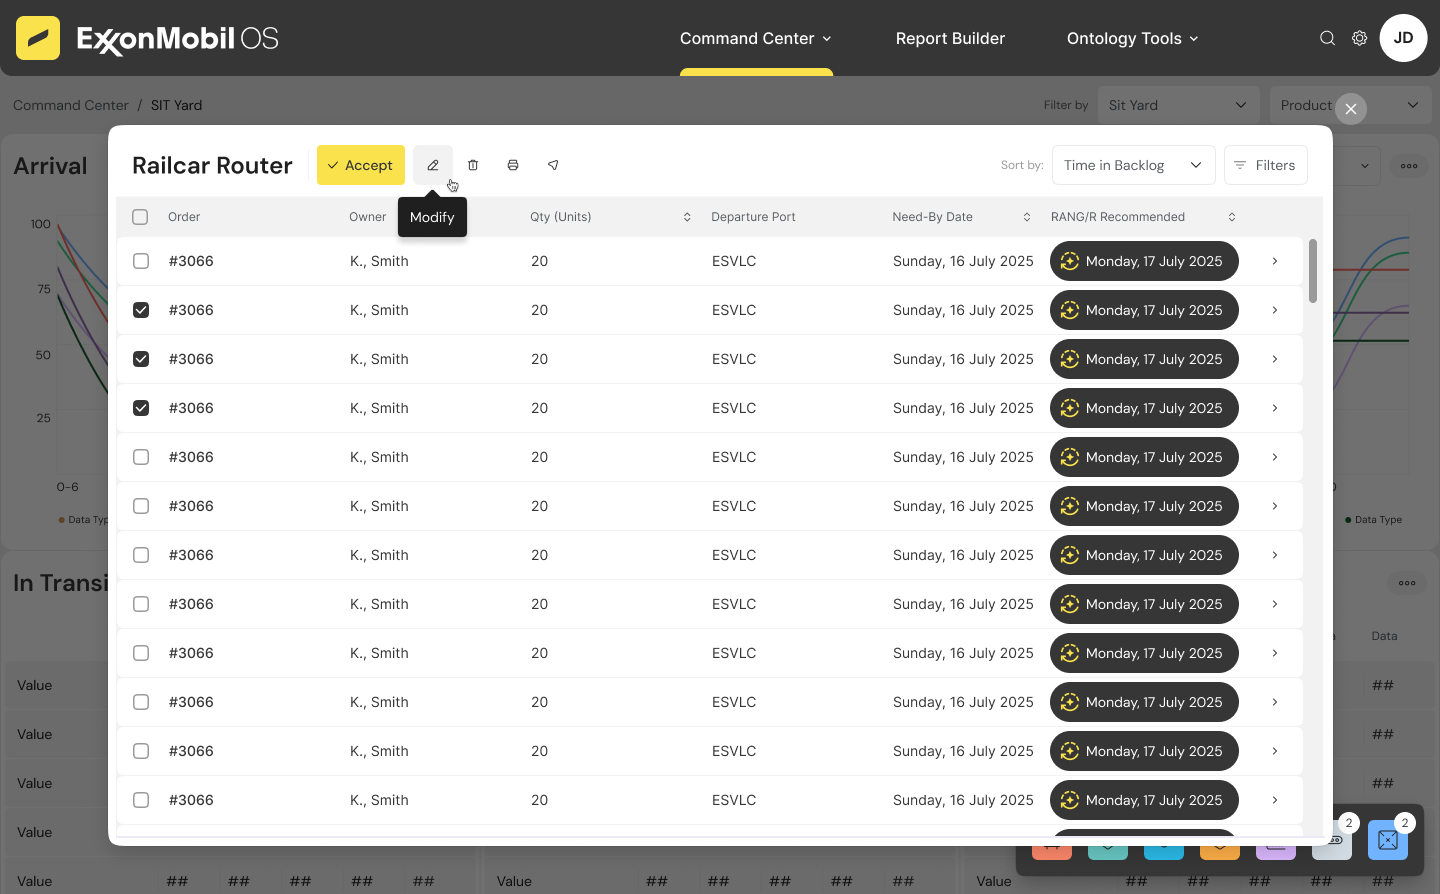
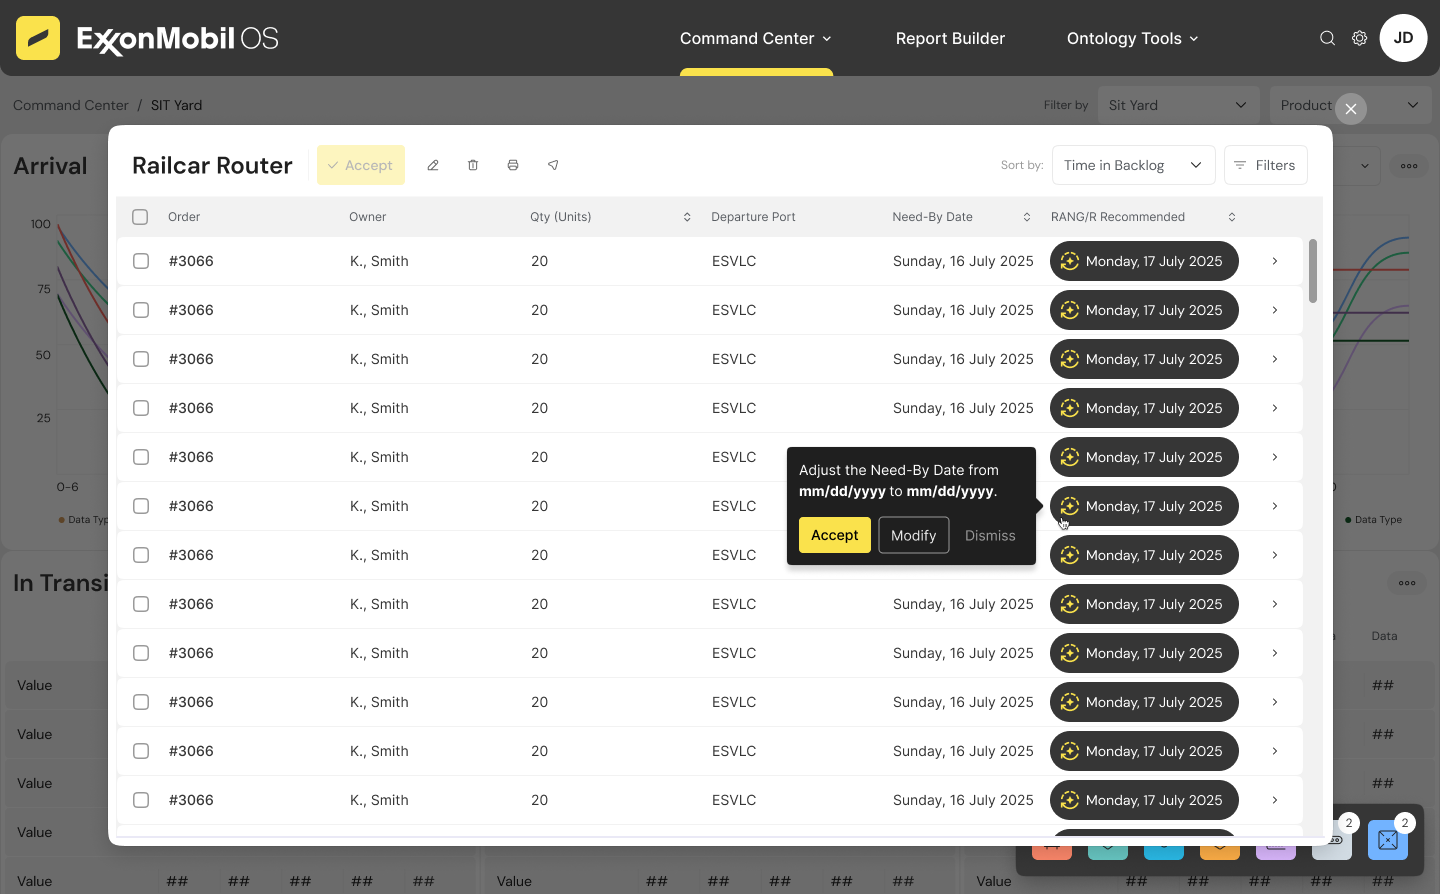
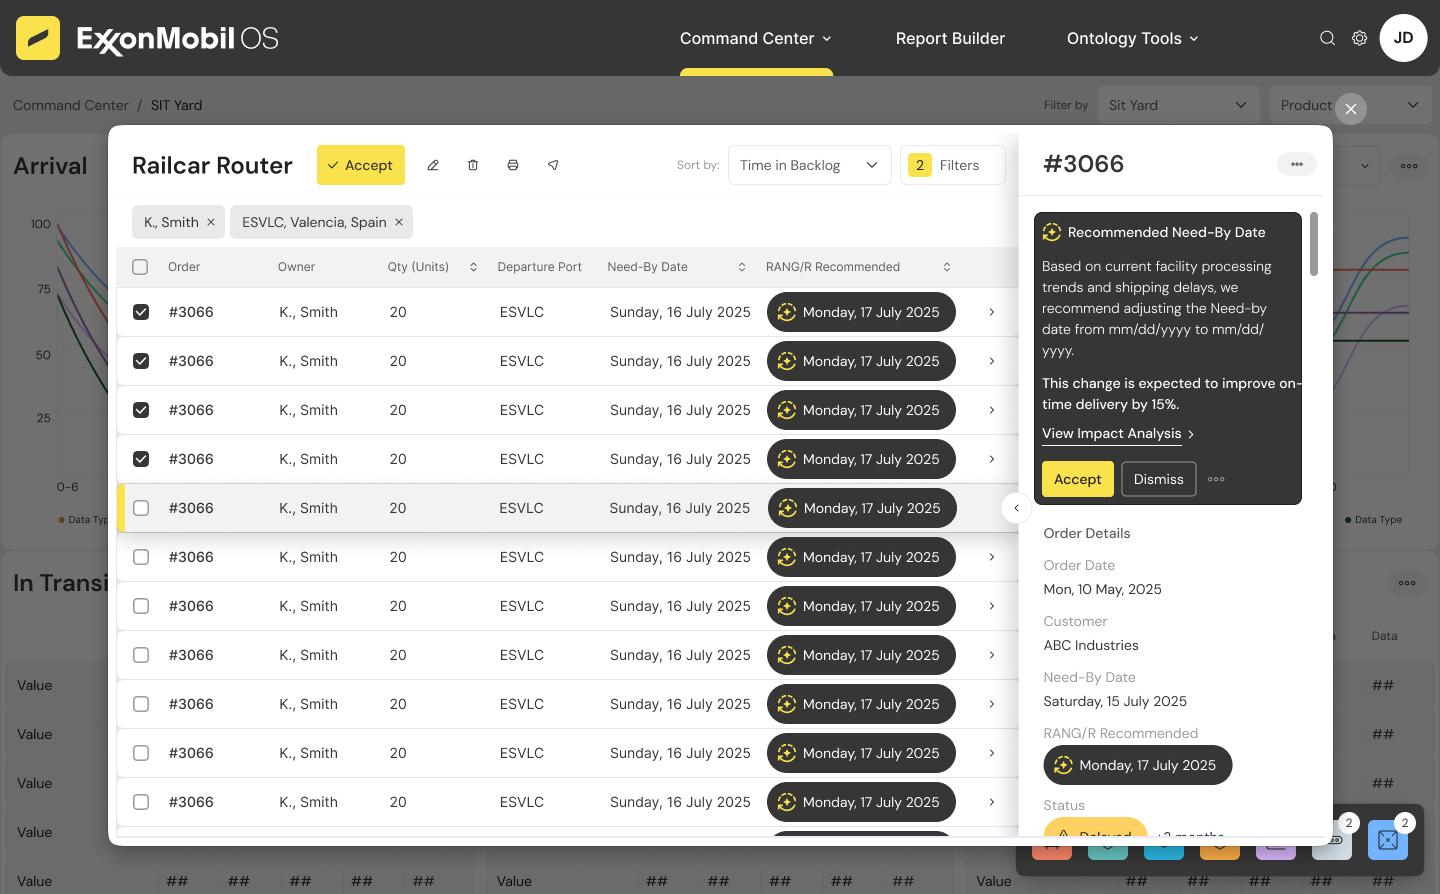
Inline Recommendations
- Grammarly‑style suggestion cards
- Confidence scores + rationale
- Accept / Modify / View Impact
Continuous Learning
- Models refine based on outcomes
- Recommendations become more tailored
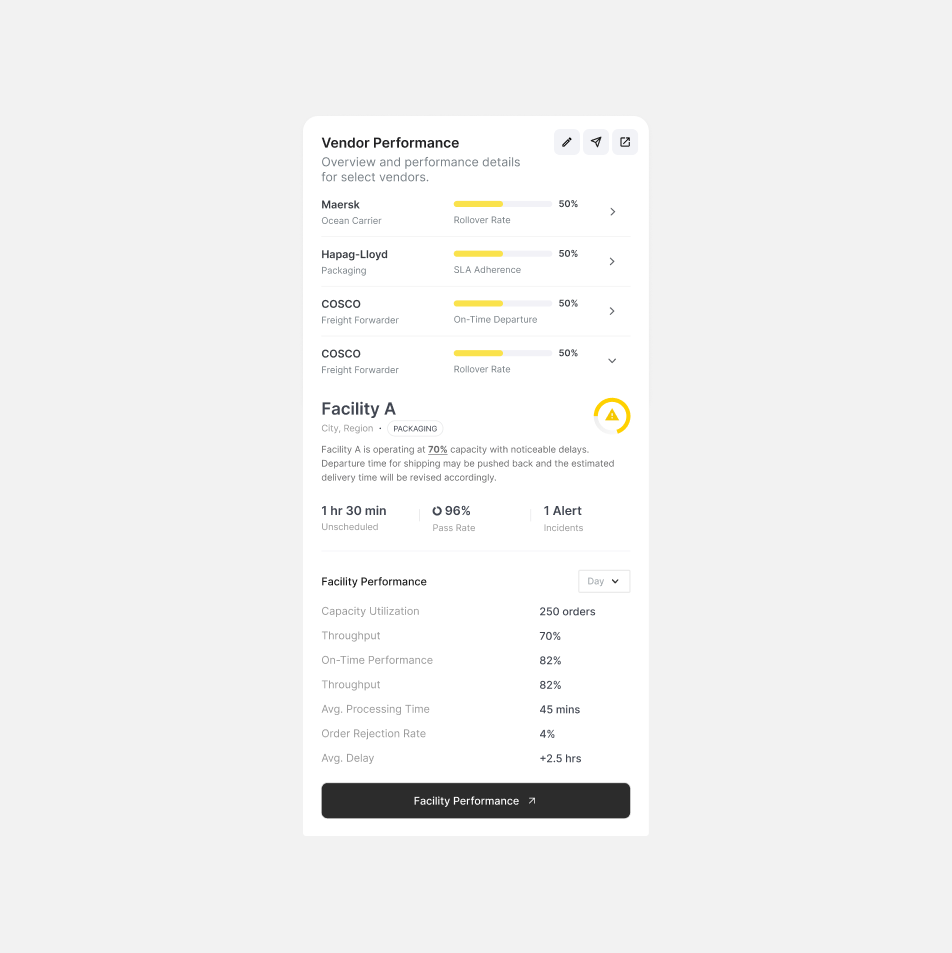
Vendor Scorecards
- Performance heatmaps
- Benchmarking
- Suggested playbooks
Future concept
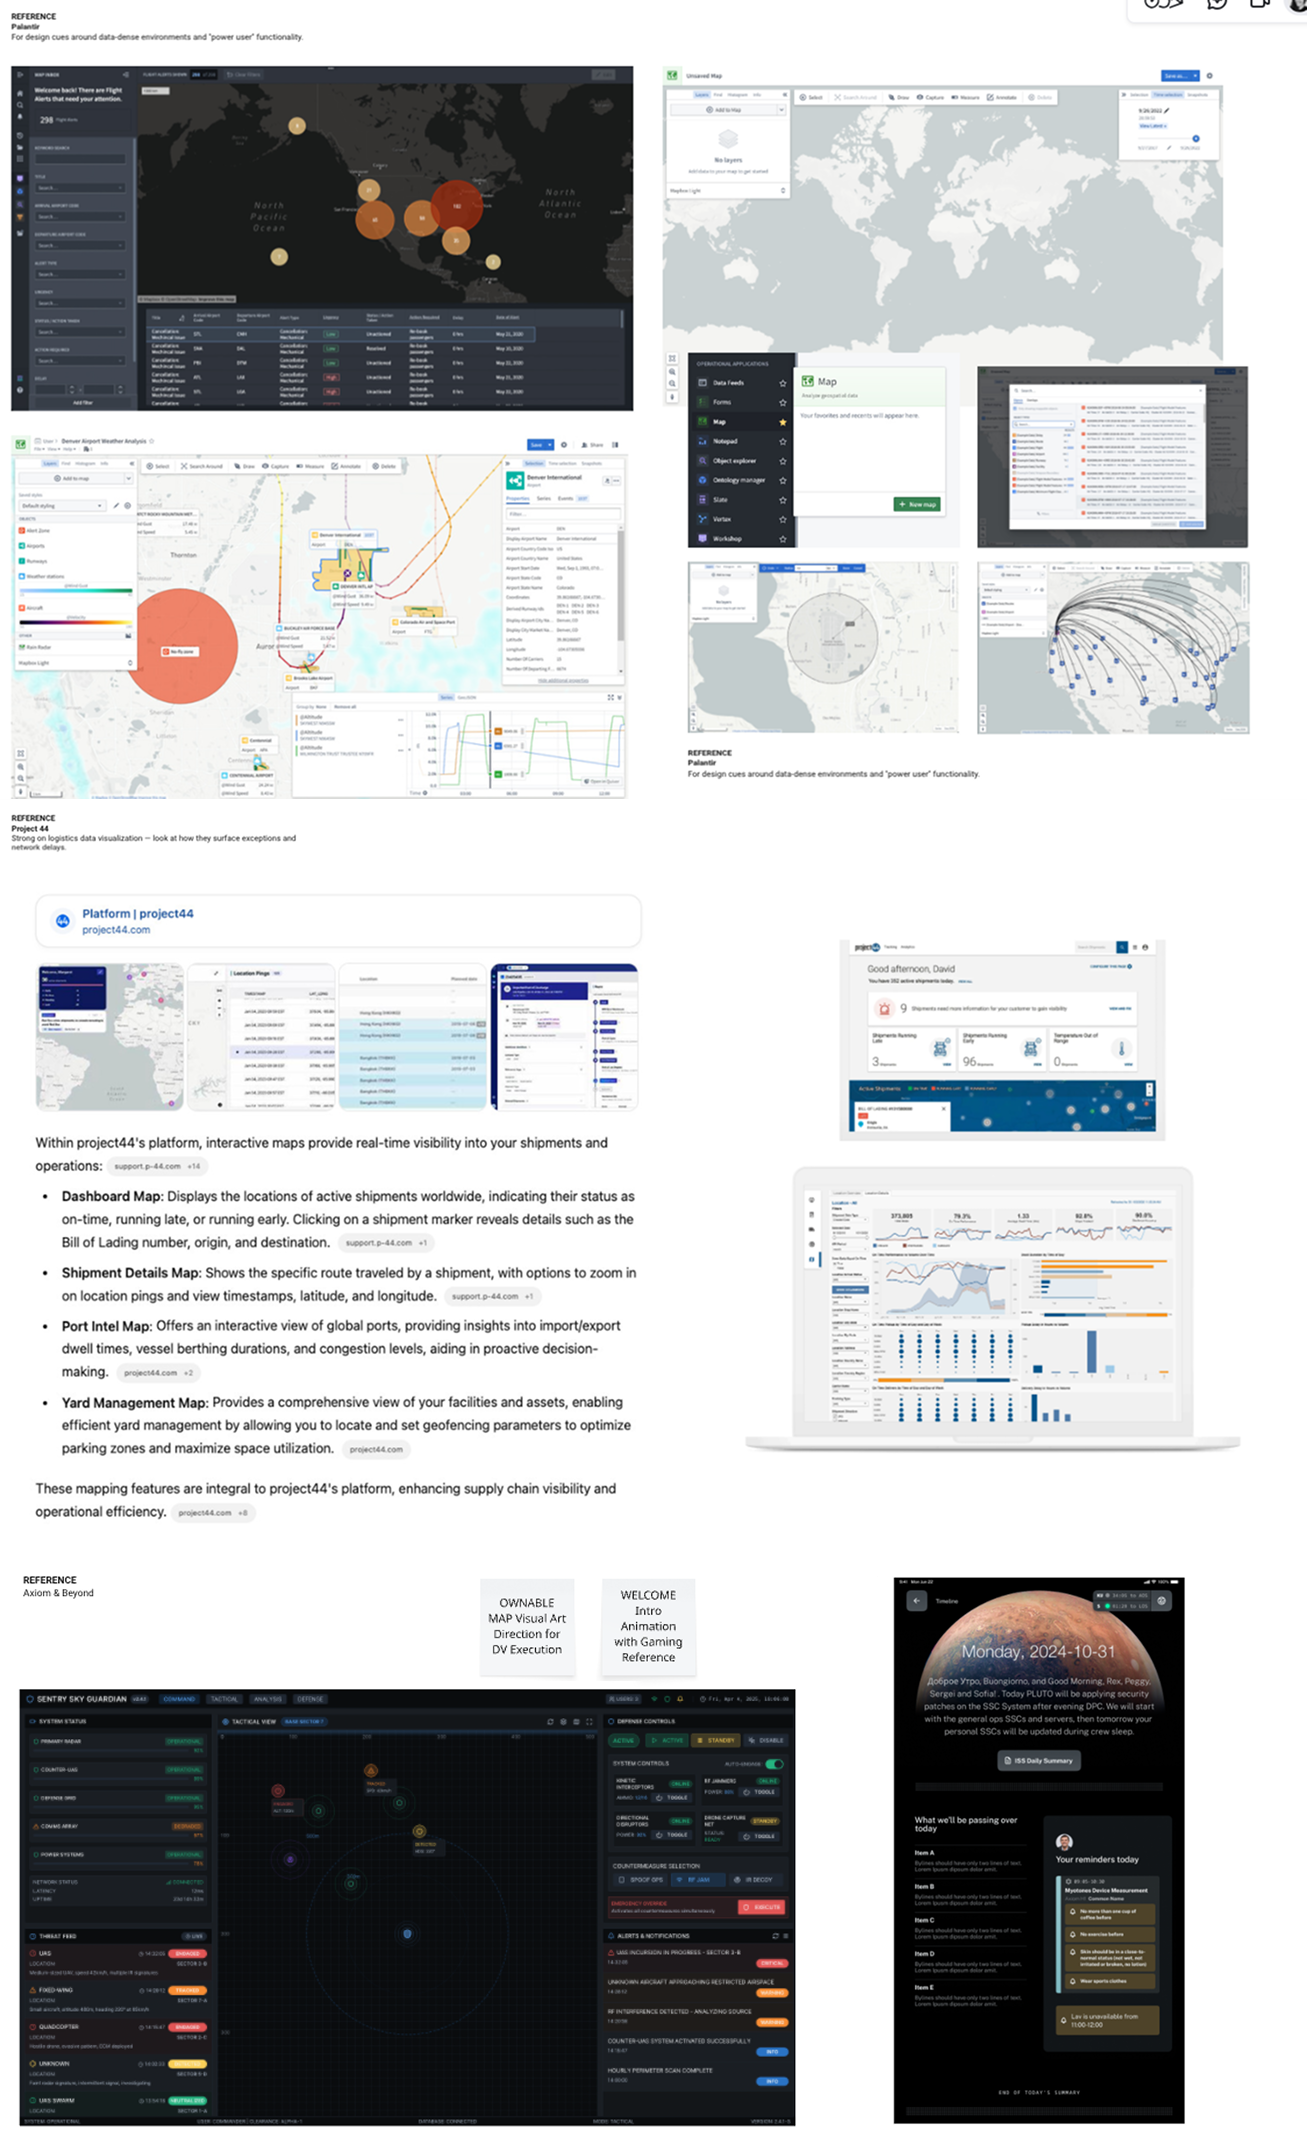
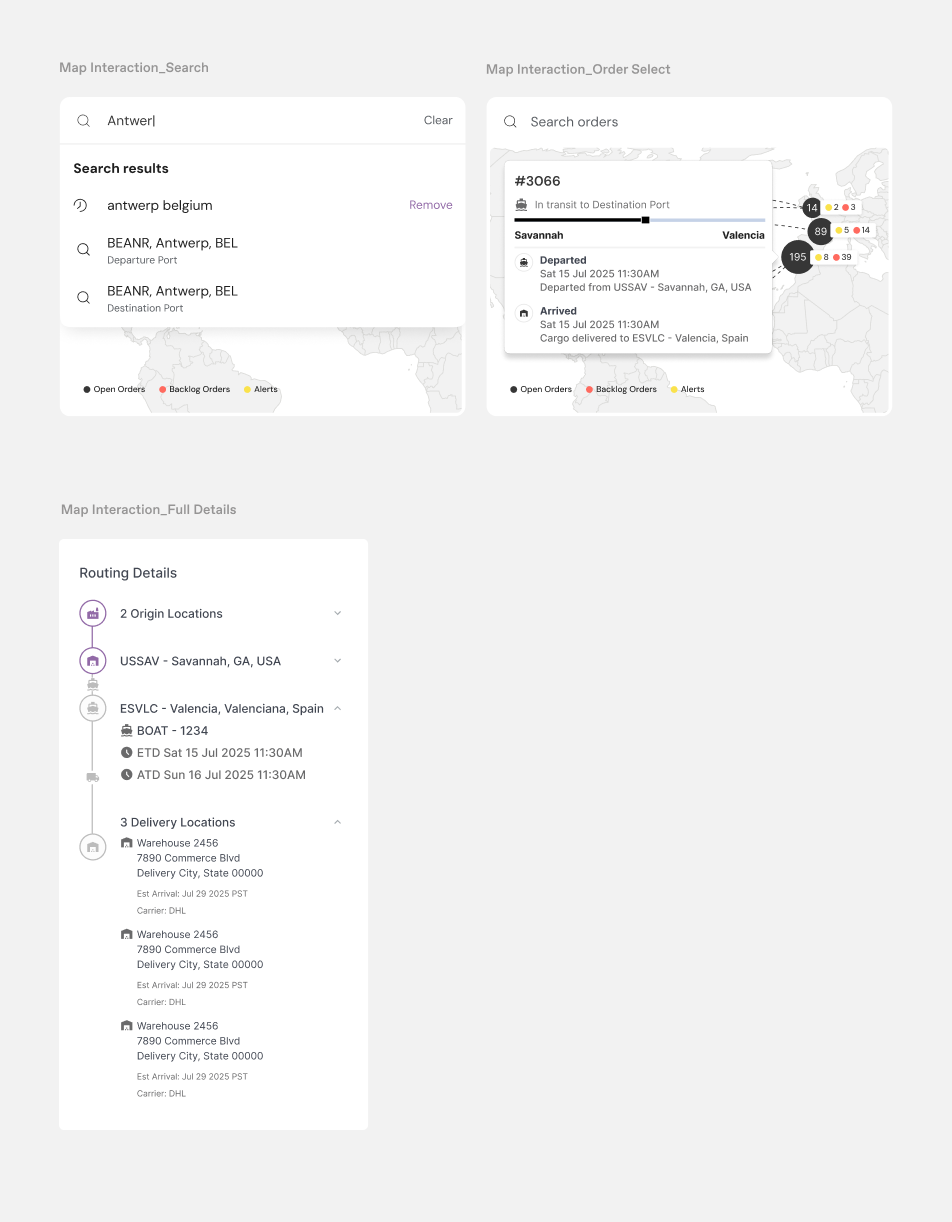
Map Application Vision
To extend AugerOS into a spatially intelligent platform, we explored a future‑state map application grounded in industry standards, market gaps, and cartographic research.
A spatially intelligent extension of XBO, grounded in TMS standards, GIS research, and cartographic interaction theory.
Industry‑Standard Features
- Real‑Time Tracking
- ETA & Delay Intelligence
- Routing & Optimization
- Inventory View
- Analytics & History
- Collaboration
Market Gaps & Opportunities
- Mode Silos → Unified Multi‑Modal View
Most tools separate ocean, rail, and drayage; XBO can merge them into a single topology. - Predictive Approaches → AI‑First Spatial Intelligence
RANG/R can forecast disruptions, capacity shortages, and bottlenecks spatially. - Advanced Routing → Constraint‑Aware Optimization
Incorporate capacity, weather, port congestion, and vendor performance. - Inventory Visibility → Spatial Inventory Health Visualize stock risk geographically, not just numerically.
- Task Orchestration → Map‑Driven Workflows
Trigger actions directly from map nodes and edges. - Sustainability Integration → Carbon‑Aware Routing
Surface emissions impact and greener alternatives.
future concept / Use Case 01
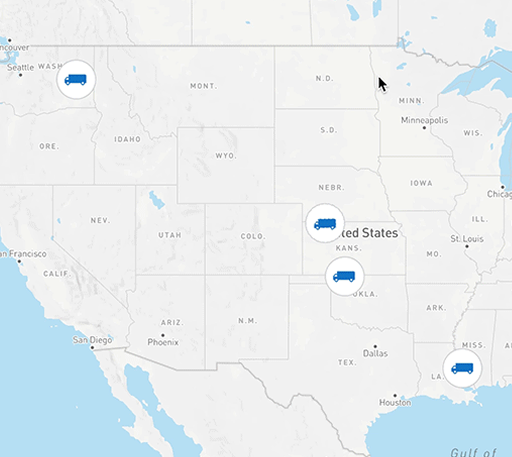
End‑to‑End Supply Chain Visibility
Use Case Requirements:
The system should provide a unified view of supply chain logistics that assist the user in identifying bottlenecks.
- Real-time shipment tracking across modes
- Disruption detection and mitigation through predictive analytic
- Map-centric alerting and decision-making interface
User Flow
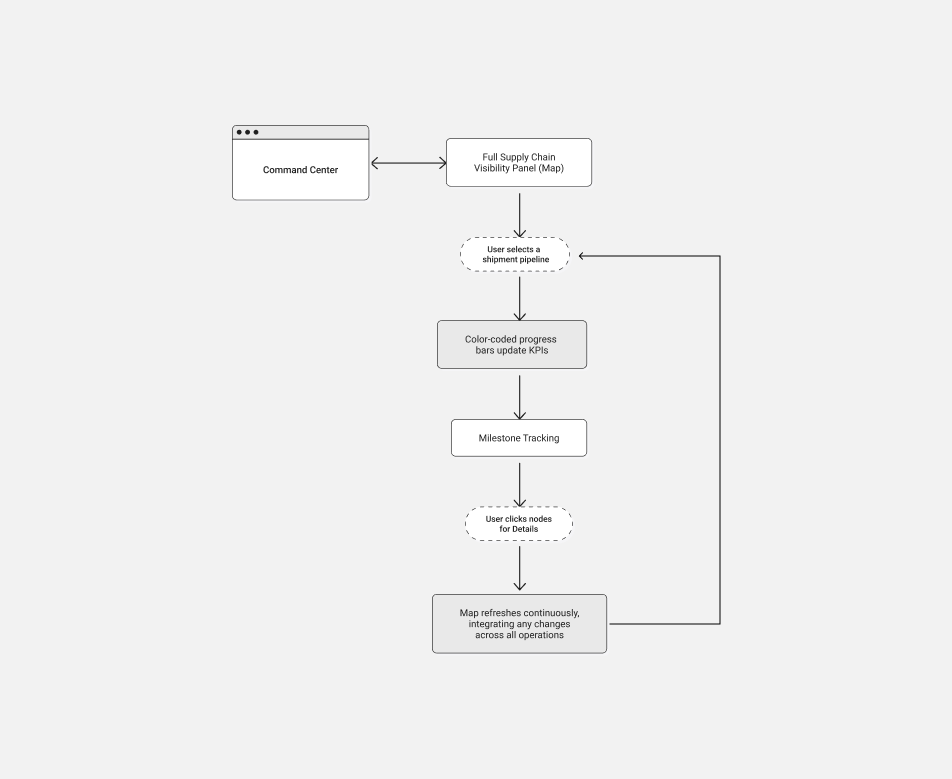
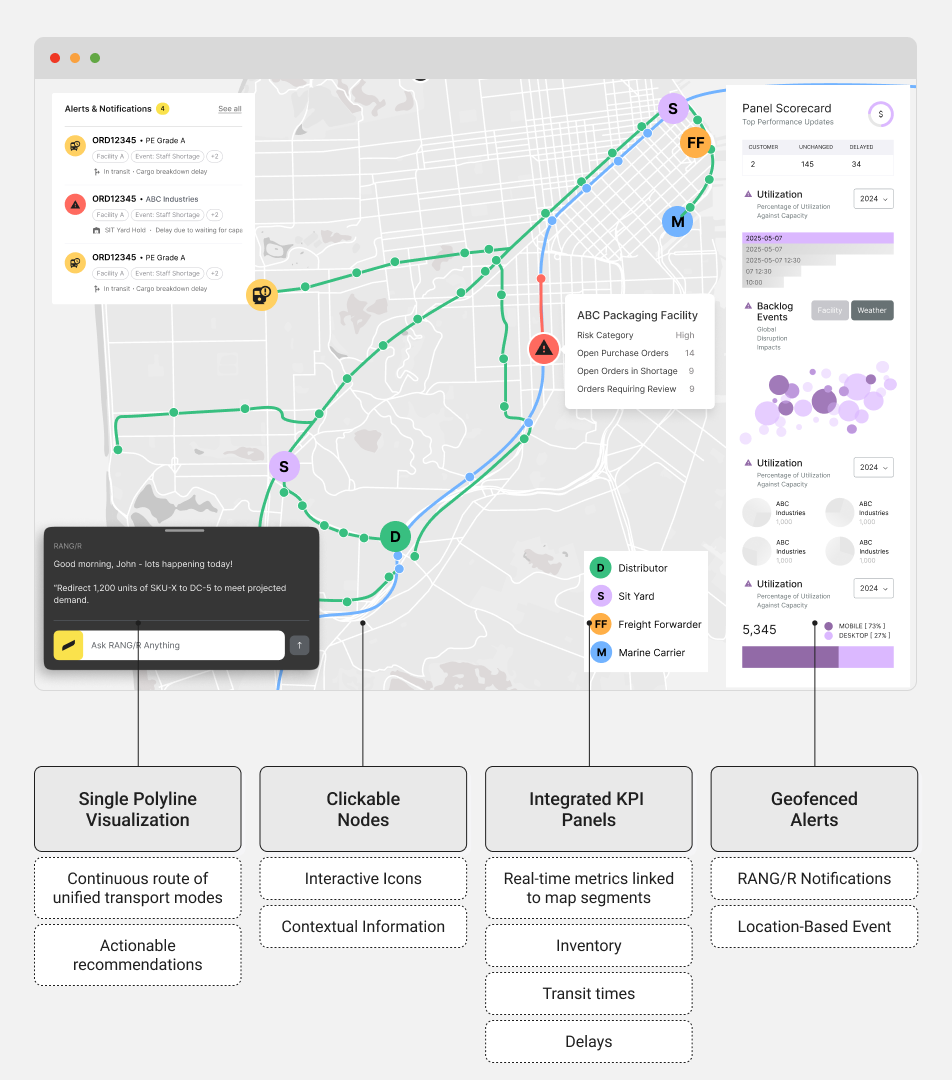
Use Case Senario:
A supply chain operator must have a single unified view of all logistics flows, from inventory staging to final-mile delivery.
1. Operator views a single continuous polyline representing the full journey (ocean, rail, truck)
2. Color transitions along the line indicate completed, in-progress, or delayed stages.
3. Clicking on nodes (e.g., port, warehouse) reveals detailed status, inventory levels, and KPIs.
4. The complete map refreshes continuously, integrating any changes across all operations.
future concept / Use Case 02
Inventory Rebalancing Recommendations
Use Case Requirements:
The system should detect imbalances, generate actionable suggestions, and allow quick initiation of transfer orders.
- Real-time inventory monitoring
- Automated stock rebalancing based on predictive insights
- Integrated map-based action triggers

User Flow
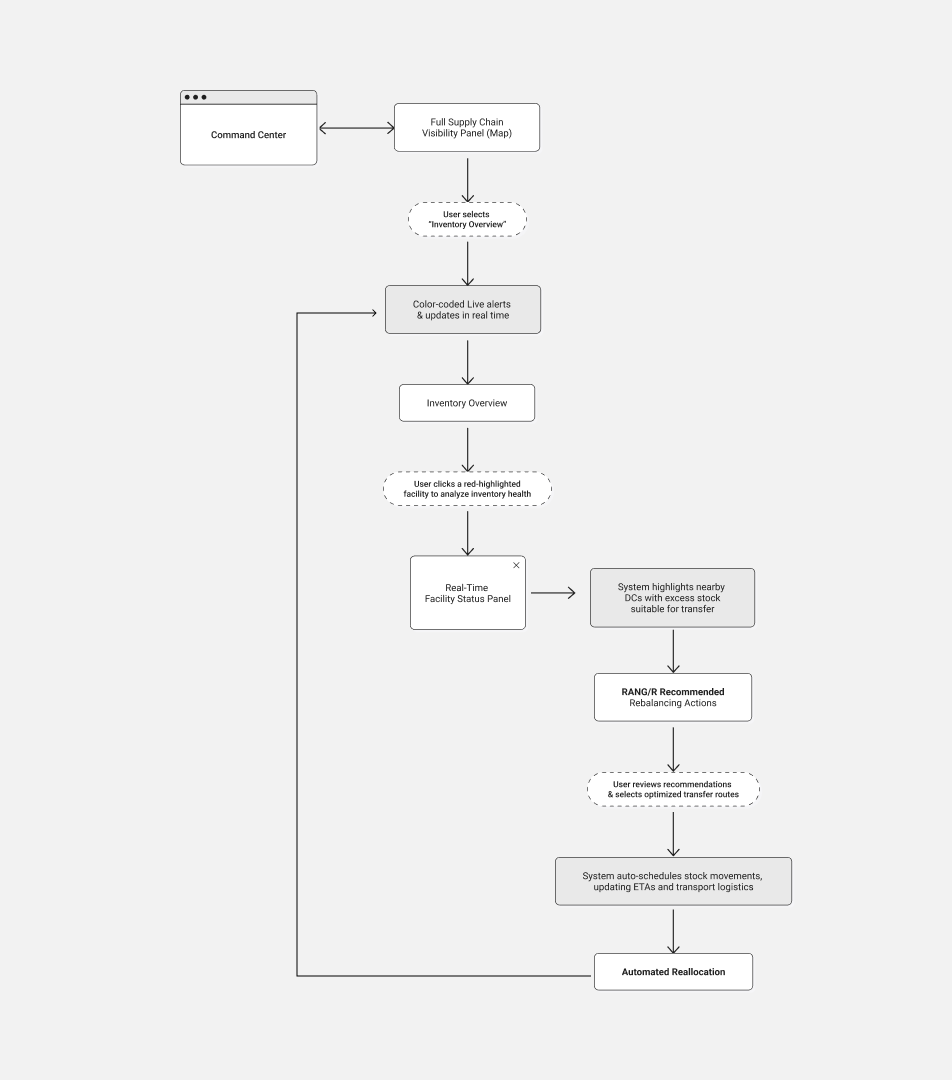
Use Case Senario:
A distribution planner needs to rebalance inventory between facilities based on real-time stock levels and demand fluctuations.
1. The user views a live map with an inventory heatmap overlay where each facility is color-coded .
2. The user clicks on a red-highlighted facility to drill down into detailed SKU-level stock data.
3. The system displays recommended rebalancing actions based on historical data and predictive analytics.
4. The user confirms the recommendation, triggering an automated reallocation workflow that updates ETAs and transport assignments in real time.
future concept / Use Case 03
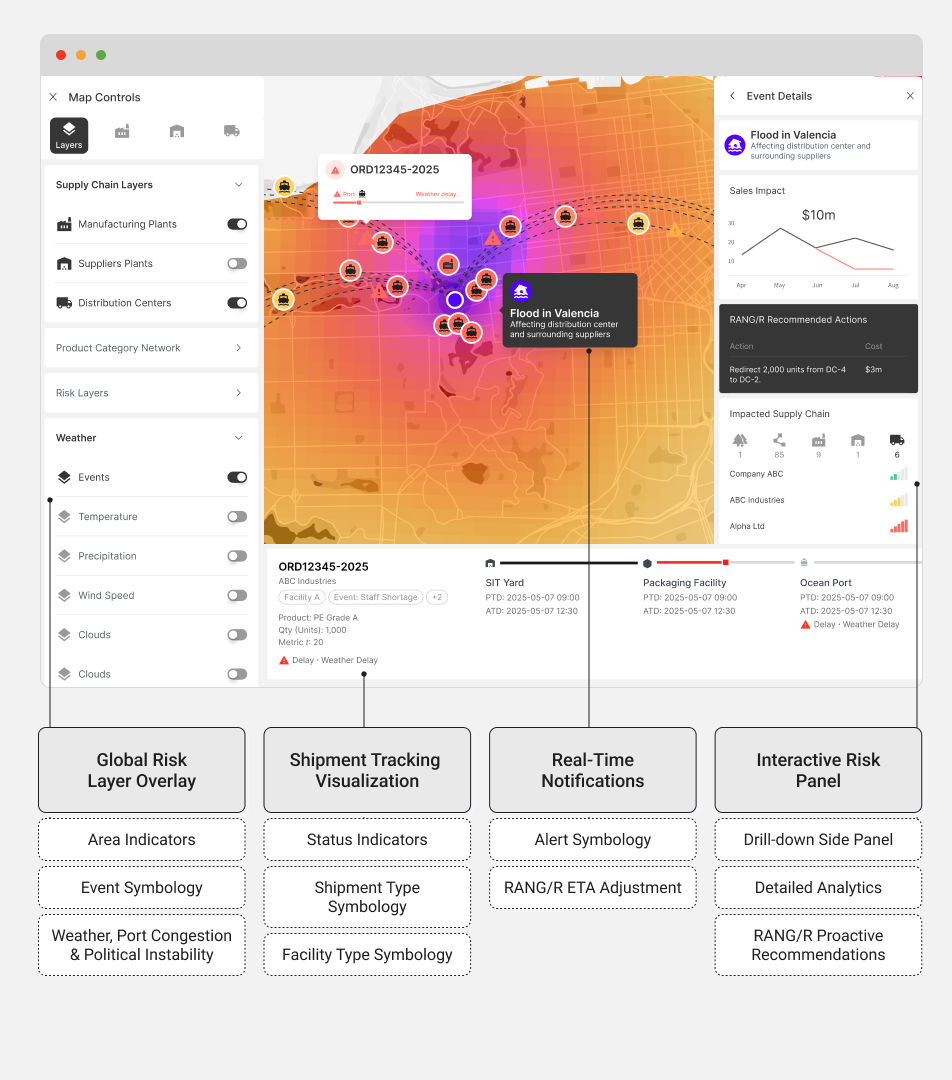
Shipment Visibility & Global Disruption Awareness
Use Case Requirements:
The system should overlay risk information and provide real-time alerts.
- Real-time shipment tracking across modes
- Disruption detection and mitigation through predictive analytics
- Map-centric alerting and decision-making interface
User Flow

Use Case Senario:
A logistics manager must monitor global shipments across multiple transport modes and quickly react to disruptions (like adverse weather or port congestion).
1. The user accesses a global map displaying shipments as icons color-coded for status.
2. A global disruption overlay appears as a heatmap across regions with potential delays.
3. Clicking on a hotspot opens a side panel showing detailed risk analytics for that area, including predictive ETAs updated by RANG/R.
4. The manager selects affected shipments and accesses options to reroute, escalate, or notify stakeholders—all initiated from the map interface.
future concept / Use Case 04
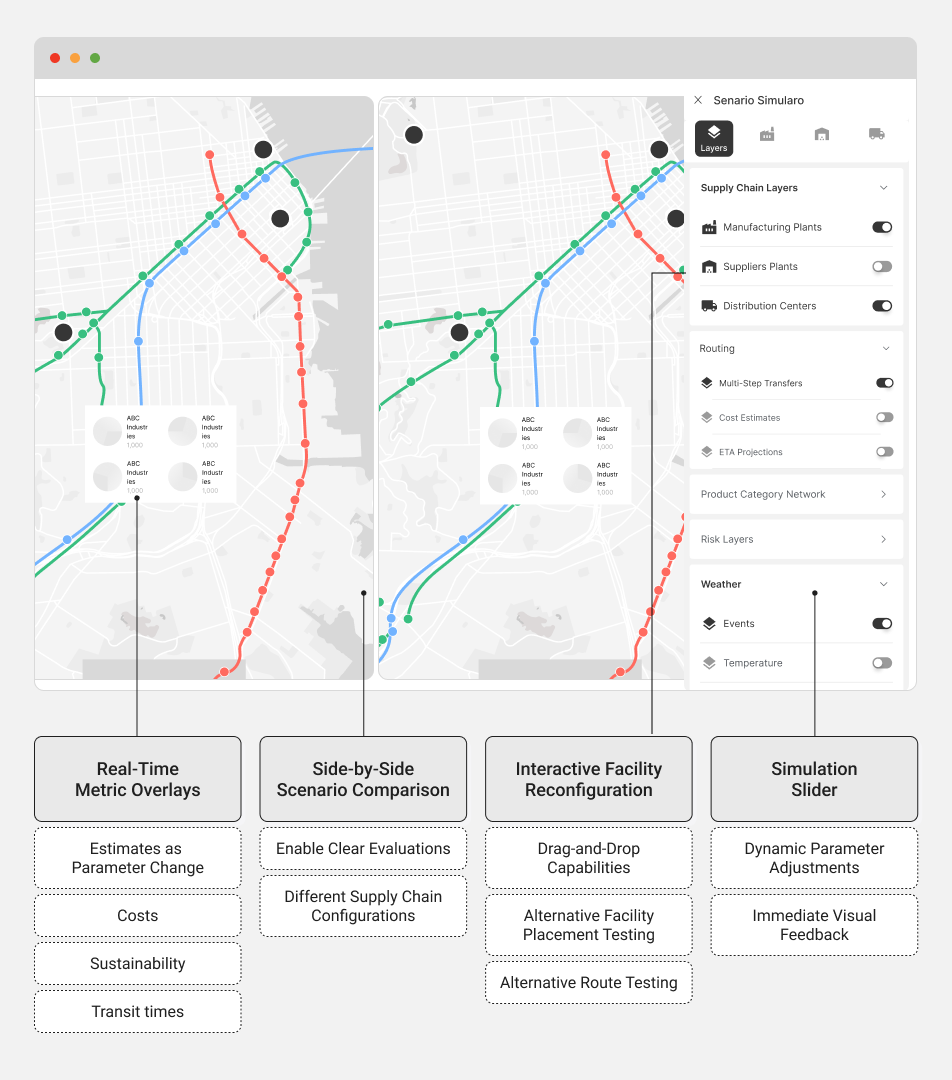
Topology Simulation
Use Case Requirements:
The simulation tool should allow objective evaluation of alternative configurations.
- Ability to run interactive simulation scenarios
- Immediate evaluation of trade-offs (cost, time, sustainability)
- Integration of simulation outcomes into planning and decision-making
User Flow

Use Case Senario:
A logistics planner needs to test “what-if” scenarios to optimize routing, reduce costs, and minimize environmental impact.
1. The planner selects a region or specific shipment route and opens the topology simulation interface on the map.
2. A simulation slider and set of interactive controls appear, allowing the user to modify parameters.
3. As parameters are adjusted, the system dynamically recalculates and displays projections for cost, time, and CO₂ emissions in side-by-side comparisons.
4. The planner views simulation outcomes, compares alternative network configurations and selects the optimal scenario.
future concept / UI Design

Transit‑Inspired Aesthetic
- Schematic lines
- Node‑edge topology
- Mode‑based color system
![]() Consistency Across Flows
Consistency Across Flows
 Consistency Across Flows
- Shared iconography
- Reusable panel patterns
- Predictive overlays powered by RANG/R
Interaction Design
- Hover micro‑details
- Side‑panel drill‑downs
- Lasso selection
- Time slider playback
Outcomes
Observed in pilots
- Faster decision cycles
One‑click actions and inline recommendations reduced decision latency. - Fewer manual handoffs
Shared context and embedded collaboration reduced coordination overhead. - Proactive operations
Predictive alerts and simulations shifted teams from firefighting to planning.
Design lessons
- Explainability is essential
Operators reject opaque suggestions; short rationales and impact previews are non‑negotiable. - Balance automation and control
Provide safe defaults but keep manual overrides visible and easy. - Design for exceptions
Most value comes from handling edge cases; design flows must prioritize exception resolution.
Retrospective
Designing XBO required balancing operational complexity, AI sophistication, and human usability. The result is a platform where intelligence and execution coexist seamlessly—where operators can see clearly, act decisively, and collaborate effectively.
This case study represents not just a product, but a design philosophy: Make complexity legible. Make intelligence actionable. Make operations human‑centered.